- Technical analysis is the study of prices over time, with charts being the primary tool. This is done by comparing current price action with historical price action to identify patterns that can suggest probable future price movement.
- Technical analysis helps traders to determine trends and acts as a signal or indicator to either buy or sell. Technical analysts believe that the historical performance of a financial instrument indicates the future performance on that instrument.
Trader Types
Short Terms
Short term traders are intraday traders who get in and get out of the market quickly by constantly opening and closing positions
Medium to Long Term
Medium to long term traders are traders who keep their open position on the market for a long period of time (weeks/months)
1. Line Chart
- A Line Chart simply shows a line from one closing price to the next closing price
- The Line Chart is not specific to the period of the chart
- A Line Chart shows us the general direction of the instrument over time
2. Bar Chart
- A bar chart goes into more detail by showing the opening and closing prices in addition to the high and low of the specified period using a straight bar/line format
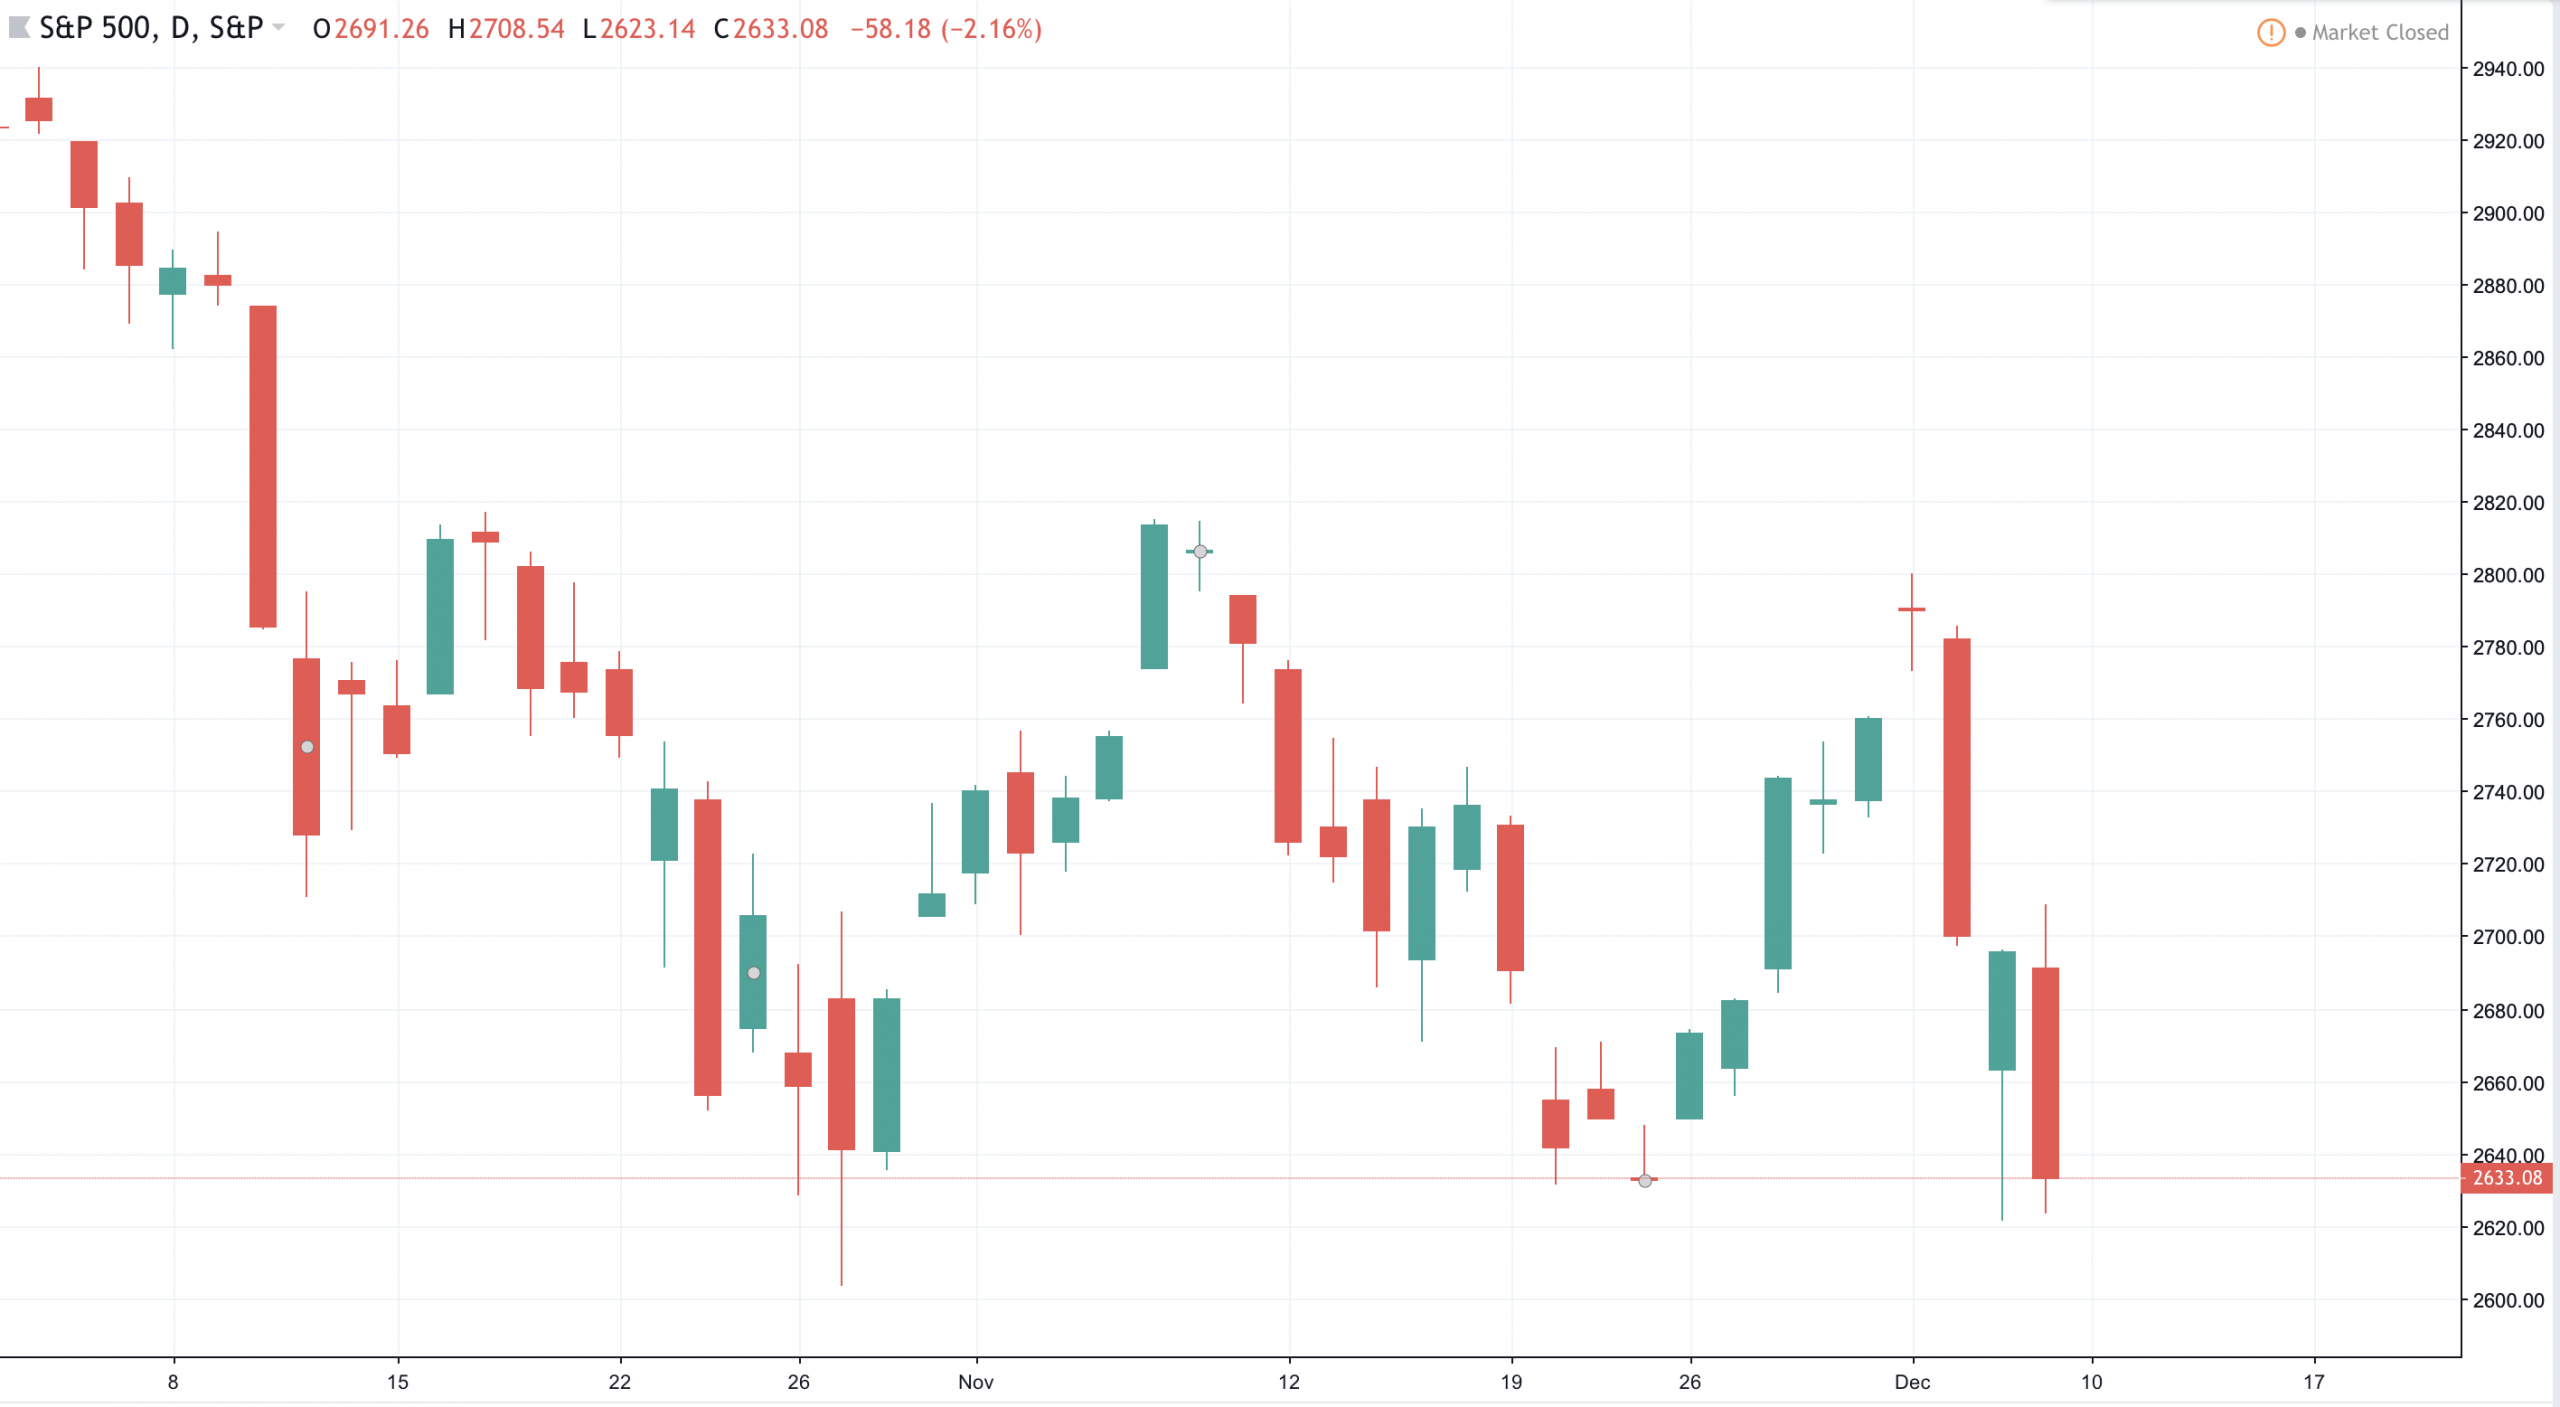
3. Candlestick Chart
- A candlestick chart also shows the opening and closing prices in addition to the high and low of the specified period and resembles a candlestick. This type of chart is easier to interpret and identify pivot points or reversals in a trend